Understanding the Work.ink Statistics
The Work.ink Dashboard, among many other features, provides you with statistics about your links. These statistics will be explained in this article.
The Dashboard Statistics
After logging into the Dashboard, you will see these 4 graphs on the start page:
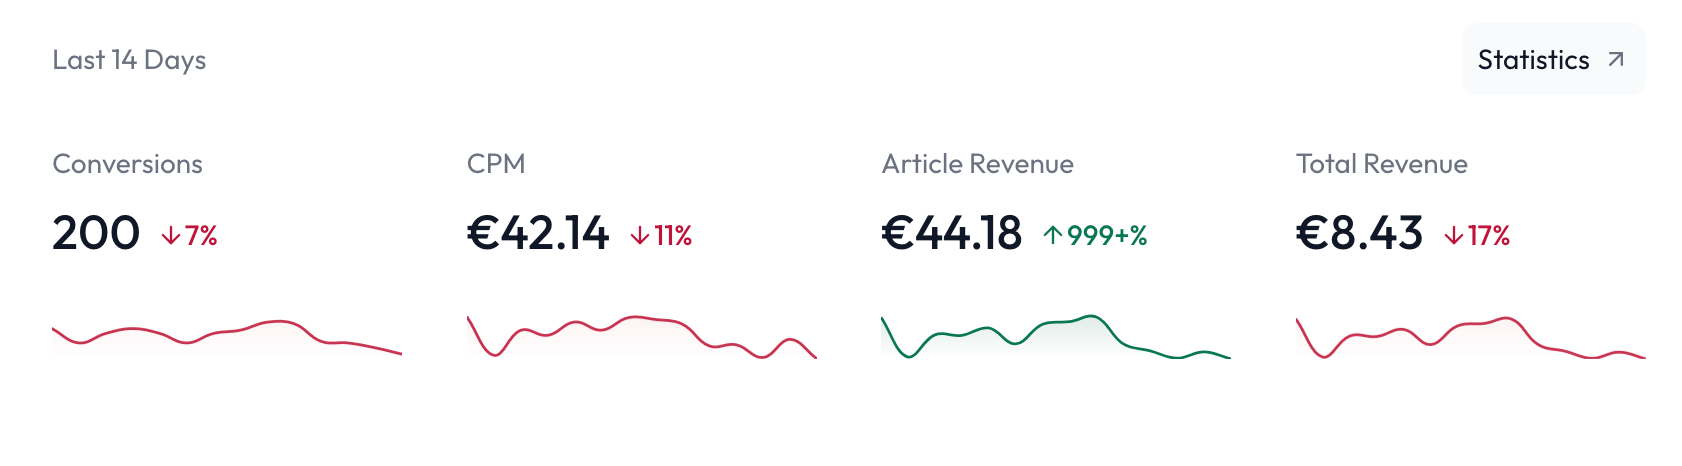
These provide you with the most relevant statistics of the last 14 days. As you can see, you can see you conversion count, your CPM, your revenue generated by the Articles monetization and your total revenue - all complete with a change percentage.
Conversion? CPM? Revenue? What?
Especially for beginners these words may seem overwhelming, but be assured, they are pretty simple to understand. Each word is explained below:
Conversion: When a user completes a monetization (e.g. installs Opera GX or clicks on an ad banner) it will be counted as a conversion. Conversions are what makes you money, while impressions are only the amount of times any user has seen something - these two are often confused.
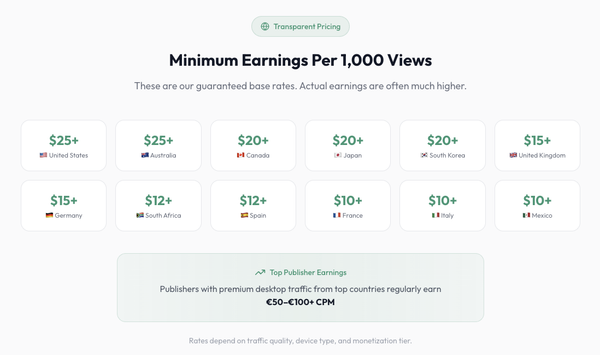
CPM: "Cost per Mille" - basically means how-much-money-per-1000-conversions. Different conversion types pay different CPMs per country per day. Thus, your overall conversion can change over time and according to the quality of traffic, you're delivering. If none of your users click on high value ads like BetterDeals and instead only click on ad banners, your CPM will drop. If your users install BetterDeals more often, you CPM will increase. It's basically a mean value of how much many you make with 1000 conversions.
Revenue: The money that you made.
Diving deeper: The Statistics Page
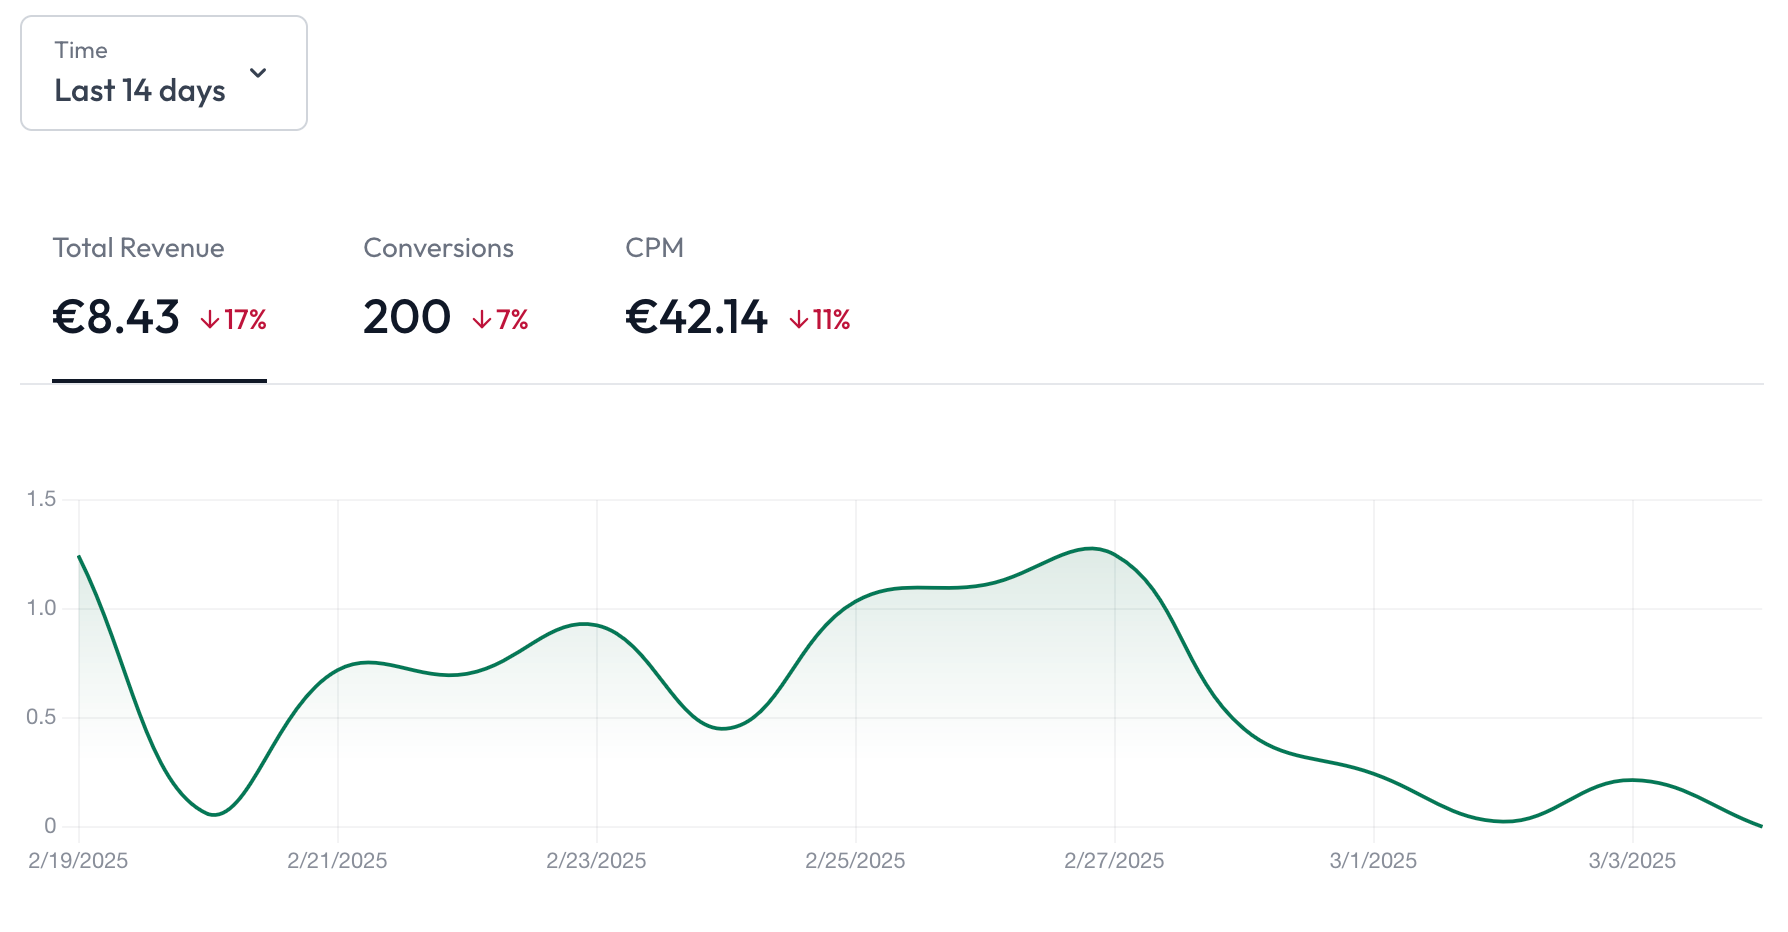
On the statistics page, you can see the same graphs, but with a higher resolution. You can hover the graph to get exact values and select a time range that you want to view:
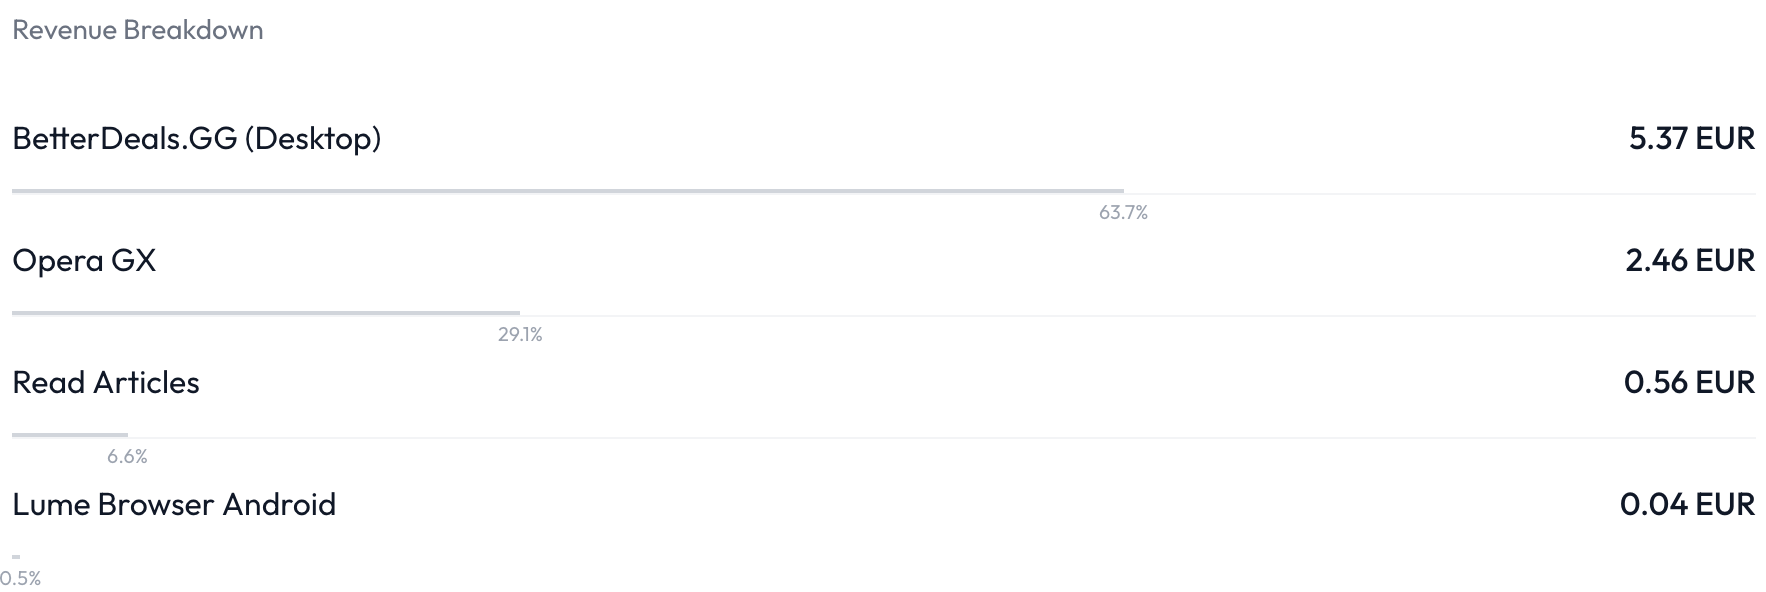
Below the graph, you can see more detailed statistics about which monetization made you how much money:
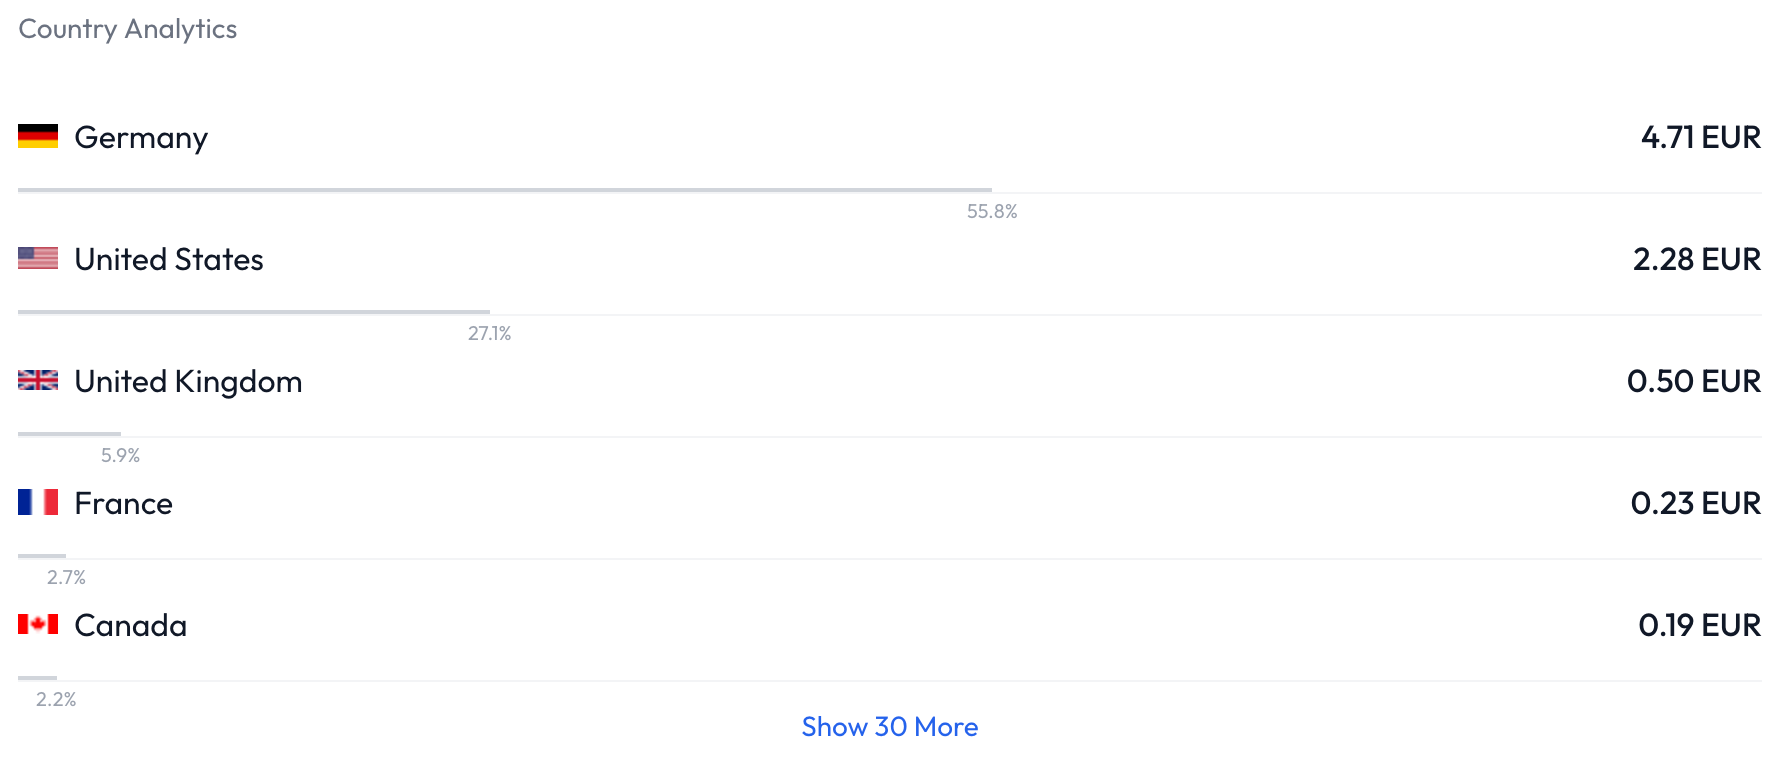
And below that, you can see which country made you how much revenue:
When scrolling down, you likely notice that a drop-down menu appears. Here you can select which metric you want to sort by. You can e.g. select "Conversions" to see how many conversions per country or monetization you have, instead of how much revenue:
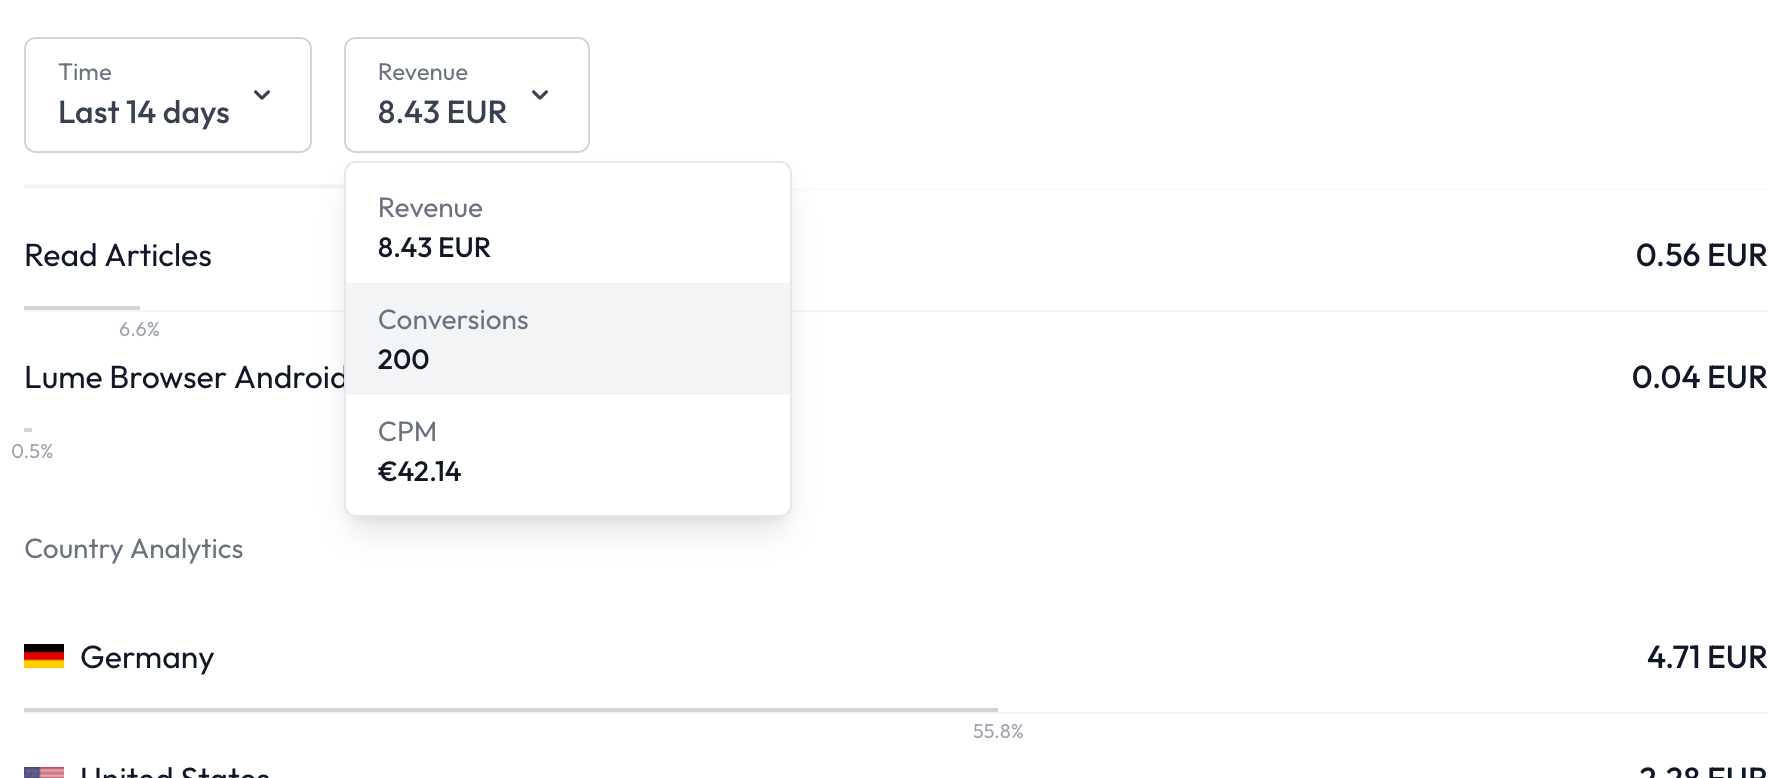
This allows you to have a more detailed look into your links' performances. But it gets even better...
Link Statistics
You can view the statistics of each link by clicking the gear-icon next to them and selecting "View Statistics". Then, this menu will open:
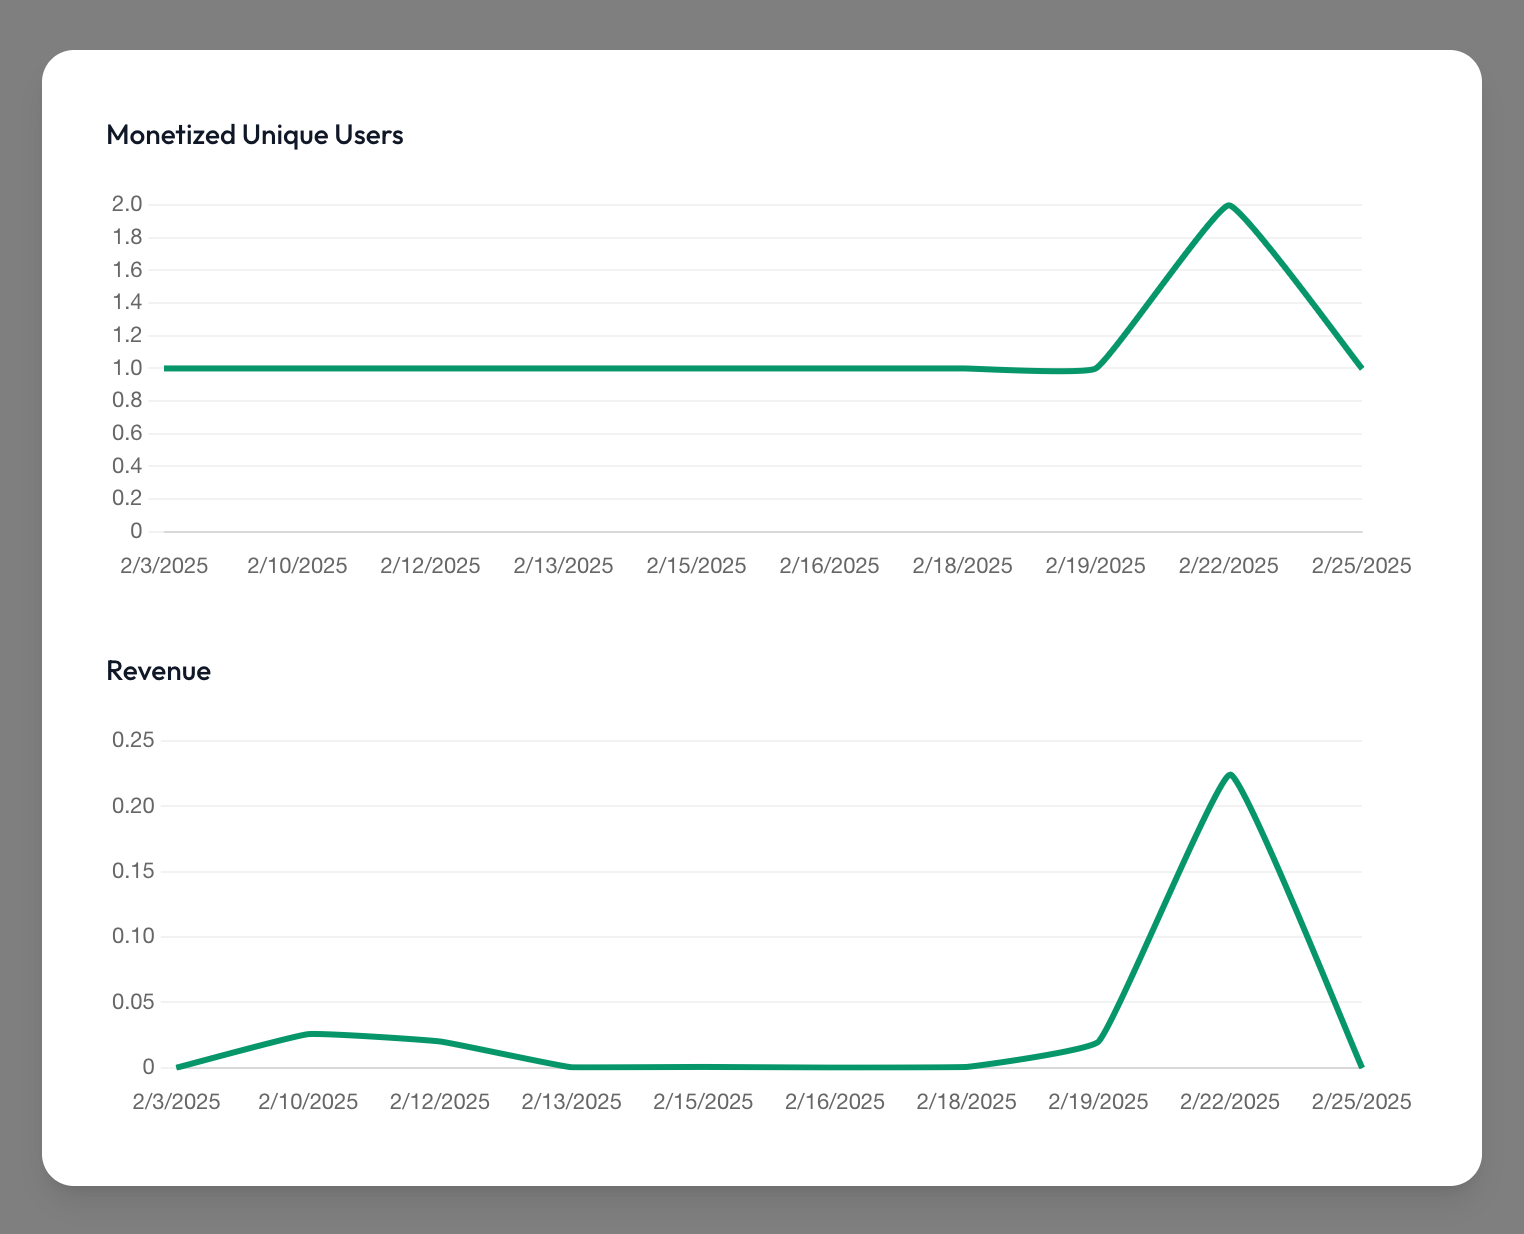
As you can see, it shows you the revenue and amount of users that have been monetized by this specific link per day (= conversions).
All these features allow you to have the most detailed statistics about your links out of any link shortener platform. We at work.ink like to keep things transparent and hope this feature helps you to optimize your performance and income.